ICP and TAM: How to Estimate the Size of Your Addressable Market
Almost every TAM slide I have ever seen was built the same way. Someone finds an analyst report that says the market is worth fifty billion dollars, claims they will capture one percent of it, and calls that a five-hundred-million-dollar opportunity. It looks impressive on a board deck. It also has almost nothing to do with how many companies will actually buy the product, at the current price, with the current capabilities.
The problem is not the math. The math is the easy part. The problem is that the number skips the one input that makes it real: a precise definition of who the product is actually for. Without that, a total addressable market is just a big round figure that falls apart the moment anyone asks a hard question.
This post is about doing it properly. It covers why your ideal customer profile, or ICP, has to come before the market size, what TAM, SAM, and SOM each measure, and how to build the estimate from the bottom up so it survives contact with an investor or a board.
Why Are Most TAM Numbers Fiction?
The classic mistake is starting from the top. You take a giant industry figure from a research firm and shave it down with a percentage you picked because it felt reasonable. This is top-down sizing, and it overstates the opportunity because the big number was never filtered for what decides whether a company can actually buy: fit, budget, tech compatibility, and urgency.
A market report counts every company in a category. Your real market is the far smaller set that matches what you sell, can afford it, and has a reason to move now. Skip that filtering step and you are not estimating your market, you are quoting someone else's.
Investors have caught on. More of them now push back on TAM slides that skip the bottom-up math and ask for account-level grounding instead. A number you cannot defend is worse than a smaller number you can, because the indefensible one costs you credibility in the room.
Start With ICP, Not With TAM
Here is the reframe that fixes most of this. Your ICP is not a marketing detail you add after sizing the market. It is the input that makes the sizing meaningful in the first place.
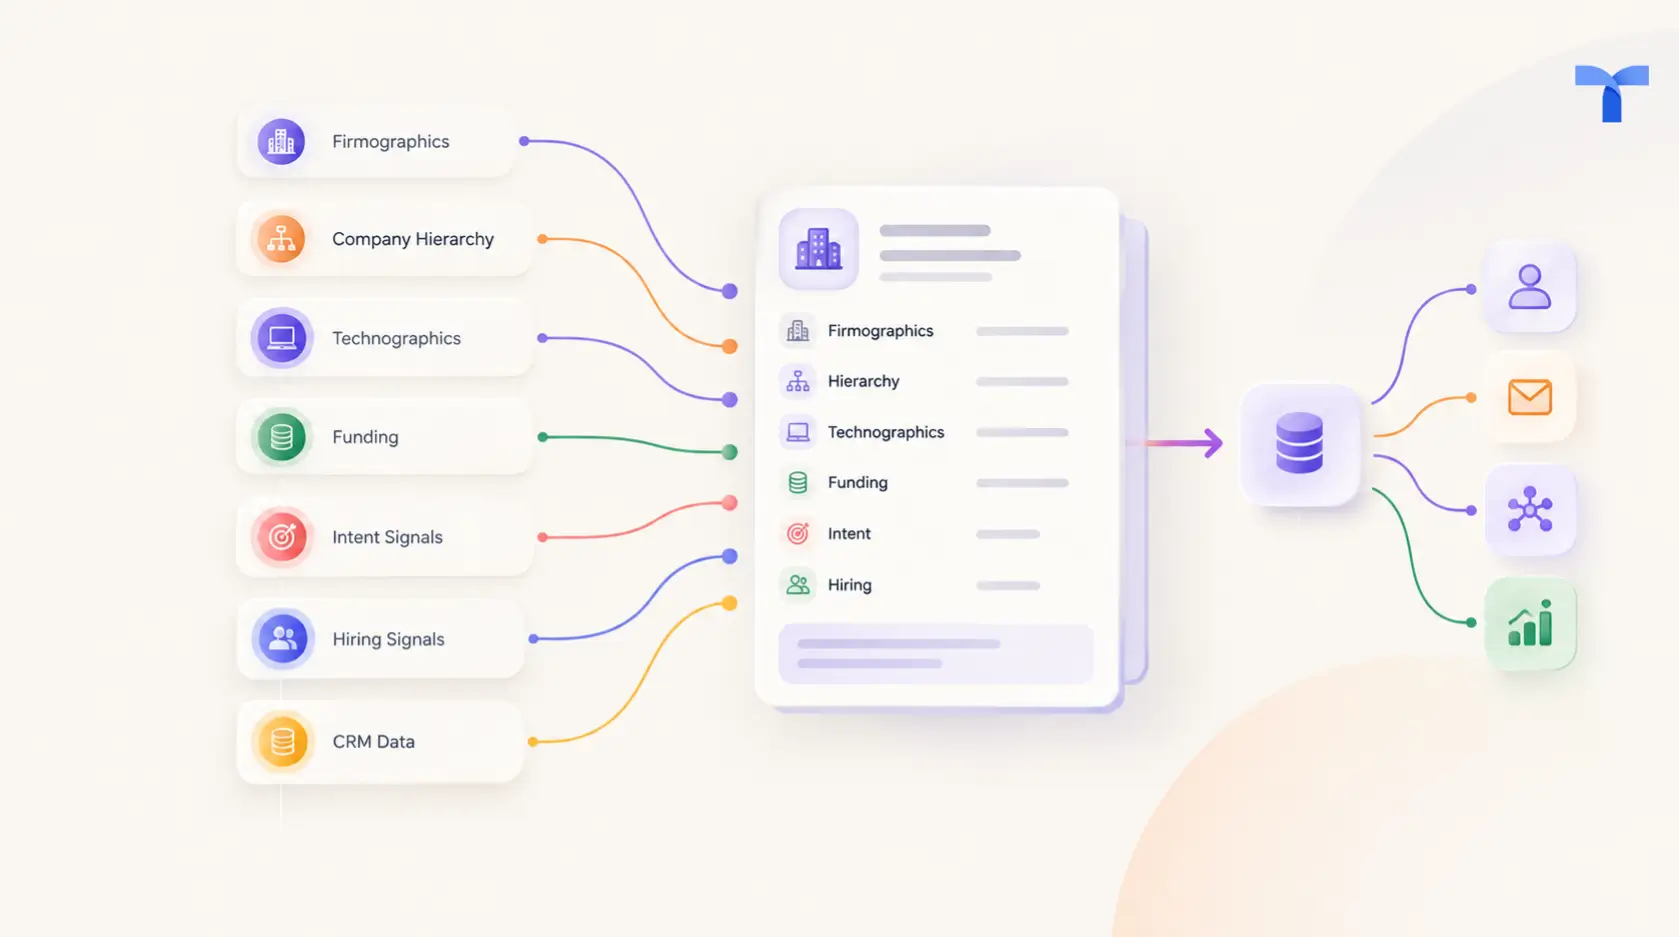
An ideal customer profile is a specific description of the companies that get the most value from your product and are the easiest for you to win and keep. It usually combines firmographics like industry, company size, and region, with technographics like the tools they already run, and with context like their stage, their budget, and a trigger that signals they are in market. The tighter and more honest that definition, the more accurate every number downstream becomes.
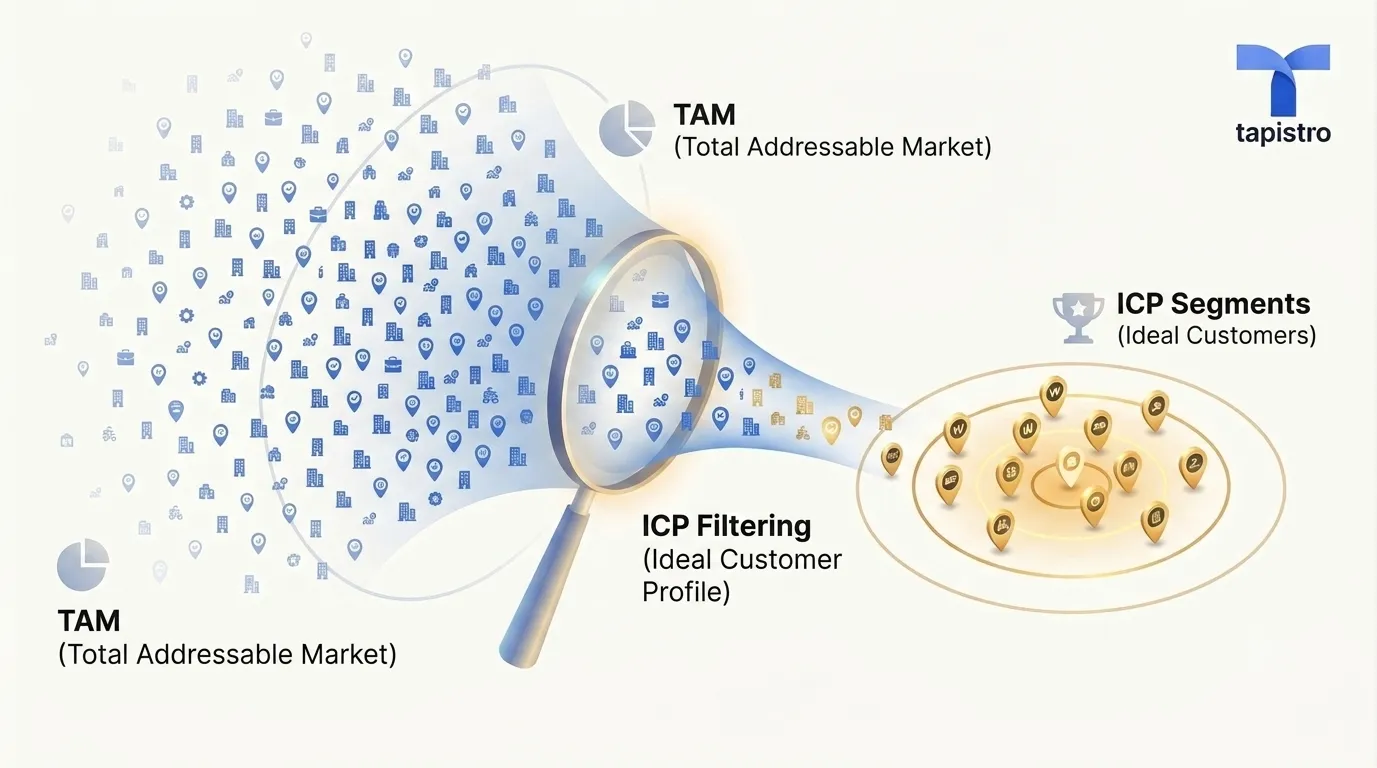
Think of the ICP as the filter you run the whole market through. The broad industry contains millions of companies. Your ICP narrows that to the ones that genuinely look like buyers. Every credible market size estimate is really just a careful count of companies that pass through that filter, multiplied by what each one is worth to you. Get the filter wrong and no amount of clean math will save the result.
What Do TAM, SAM, and SOM Each Measure?
Once you have an ICP, the three market layers stop being buzzwords and become a simple funnel from "everyone in theory" to "what we can win this year."
Total addressable market, or TAM, is the total revenue available if every company that could ever use a product like yours bought it. It is the whole category, the ceiling. Useful for direction, dangerous when treated as your actual opportunity.
Serviceable addressable market, or SAM, is the slice of TAM that matches your ICP and that you can actually reach and serve today. This is where the ICP does its work: SAM is TAM after you remove the companies that are the wrong size, in the wrong industry, outside the region you sell to, or on a tech stack you do not support. SAM is the number that actually describes your business.
Serviceable obtainable market, or SOM, is the share of SAM you can realistically win in a given period, given your team, your competition, and your motion. Be honest here. For a new B2B product, a credible SOM is usually about 1 to 5 percent of SAM in the first one to three years, not the ten percent or more that founders love to pitch.
The relationship is a nesting doll. SOM sits inside SAM, which sits inside TAM. If your SOM is a big fraction of your TAM, you have almost certainly sized something wrong.
How to Actually Estimate It, Bottom Up
Top-down gives you a ceiling. Bottom-up gives you a number you can defend. Serious sizing is done bottom-up, by counting real accounts rather than shaving down a giant figure. Here is the sequence I use.
Step 1: Write the ICP down precisely
Turn your ICP into concrete, countable filters. Not "mid-market SaaS companies," but "B2B software companies, 200 to 2000 employees, in North America, running Salesforce, with a revenue team of ten or more." The more countable the criteria, the more real the estimate.
Step 2: Count the accounts that match
Now count how many companies actually meet that definition. This is the step that separates a real estimate from a guess, and it is mostly a data problem. You need a current, accurate account universe, which is exactly where firmographic and technographic data does the heavy lifting. Tapistro's TAP AI Agents research and enrich accounts across more than 70 signal sources, so the count reflects the real market today rather than a stale list.
Step 3: Multiply by realistic value
Multiply the account count by the average annual contract value you can charge that segment. That gives you a bottom-up SAM built from companies that exist, priced at what they will actually pay. Compare it to your top-down TAM as a sanity check. If they are far apart, trust the bottom-up number and find out why the top-down one was off.
Step 4: Apply an honest capture rate for SOM
Finally, apply a realistic share based on your capacity and competition to get SOM. This is your near-term target, the market you can actually go win, and it should map to what your team can execute this year.
The discipline that makes all of this credible is data quality. The math is the smallest share of the work. The verified inputs, an accurate account universe and honest pricing, are the rest.
Keep It Living, Not a One-Time Slide
The biggest change in how good teams size markets is that the number is no longer a slide you build once for a fundraise and forget. Your ICP evolves as you win and lose deals, and every time it sharpens, your SAM and SOM should be recalculated.
This is where market sizing connects to daily GTM rather than sitting in a strategy doc. When your ICP lives inside a system that watches real wins, losses, and buying signals, the account universe updates itself, and your addressable market becomes a current figure you can act on. At Tapistro, the ICP definition improves continuously as engagement and outcome data flow in, so the same model that tells you how big your market is also tells your team which accounts in it to work next.
The Bottom Line
A market size is only as honest as the ICP behind it. Start there. Define who actually buys, in countable terms. Count the real accounts that match, price them at what they will pay, and apply a capture rate you can defend. Treat TAM as the ceiling, SAM as your real business, and SOM as this year's target. Then keep the whole thing current as your ICP learns.
Do that and you replace an impressive but fragile number with a smaller, sturdier one that holds up in front of a board and actually guides where your team spends its time. That is the layer we built Tapistro to run, so your addressable market is grounded in the accounts that are really out there, not in a report someone else wrote.