
.avif)
Not All Signals Are Equal: How to Identify the Signals That Actually Convert
Most GTM teams are drowning in signals while starving for insight.
The promise of intent data was clarity. Know who is in-market. Prioritize the accounts showing buying behavior. Act before competitors notice. The reality looks different. CRMs overflow with intent scores. Marketing automation triggers on every micro-interaction. Sales receives prioritized lists that somehow include everyone. The signal-to-noise ratio has inverted.
Access to more buyer data has not produced proportional improvements in conversion rates. Teams that track hundreds of signals often perform no better than teams tracking a handful. The difference lies not in detection capability but in discrimination capability. Identifying which signals predict outcomes and which signals merely correlate with activity.
The Volume Trap
Signal abundance creates a specific failure mode. When everything triggers a score update, nothing triggers meaningful action. A pricing page visit adds points. A content download adds points. An email open adds points. The lead score climbs steadily while actual buying intent remains unchanged.
This is the volume trap. Teams optimize for signal capture, assuming more data yields better decisions. The opposite often proves true. High-volume signal environments create cognitive overload for sales teams, dilute the meaning of priority indicators, and mask the handful of signals that genuinely predict conversion. The scale of this problem shows up in the data: MarketingSherpa research found that 61% of B2B marketers send all leads directly to sales, yet only 27% of those leads are actually qualified. The volume is there. The signal quality is not.
The problem compounds when signal sources multiply. First-party website data, third-party intent providers, product usage analytics, email engagement metrics, ad interaction data. Each source generates its own signal stream. Without a framework for evaluating relative signal quality, lead scoring models that weight every input equally replicate this problem at scale. The signals are not all equal.
Signal Strength vs Signal Noise
Strong signals share common characteristics. They indicate specific intent rather than general interest. They occur at decision-relevant moments in the buyer journey. They correlate with historical conversion patterns in your specific business context.
Weak signals share different characteristics. They occur frequently across both converting and non-converting accounts. They indicate activity without indicating direction. They inflate engagement metrics without predicting outcomes.
Consider two signals from the same account. Signal one: a prospect downloads a general industry report from your resource library. Signal two: the same prospect visits your pricing page, then your integration documentation, then returns to pricing within a 48-hour window. Both register as engagement. One indicates research behavior common to students, analysts, and competitors. The other indicates evaluation behavior specific to active buyers.
Recency and frequency alone do not determine signal strength. A prospect who visits your blog weekly for six months generates high frequency and recent activity. A prospect who visits your pricing page once after viewing a competitor comparison generates low frequency and potentially older activity. The second signal often predicts conversion more reliably than the first.
Correlation vs Causation in Intent Data
Intent data operates on correlation. Accounts that eventually convert often exhibit certain behaviors before conversion. The logical leap assumes those behaviors caused or indicated the conversion. This assumption fails more often than vendors acknowledge.
Content engagement correlates with conversion because engaged accounts are more likely to be evaluating solutions. But content engagement also correlates with research that never leads to purchase. The signal captures both populations without distinguishing between them.
Third-party intent data faces a particular version of this problem. When an intent provider reports that an account is researching your category, that signal reflects topic interest across the buying committee. It does not indicate budget availability, timeline urgency, or decision authority. Accounts can research categories for years without purchasing. The intent signal remains technically accurate while providing limited predictive value.
Testing signal causality requires comparing outcomes. Examine accounts that exhibited a specific signal and converted. Examine accounts that exhibited the same signal and did not convert. If the conversion rates differ meaningfully, the signal carries predictive weight. If conversion rates are similar regardless of signal presence, you have identified correlation without causation.
Building a Signal Hierarchy for Your GTM Motion
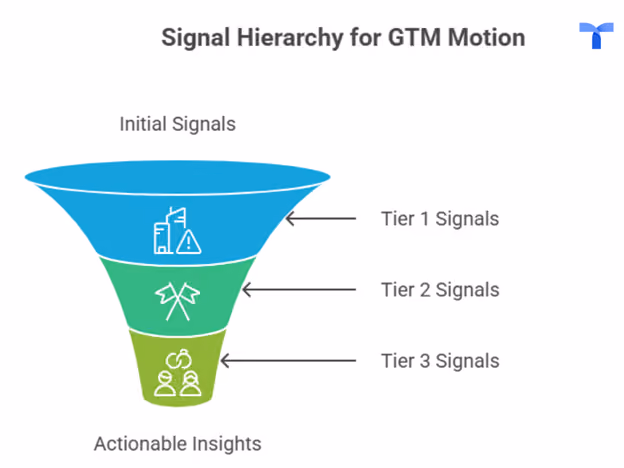
Effective signal management requires explicit hierarchy. Not all signals deserve equal weight in scoring models or equal attention from revenue teams. A three-tier framework provides operational clarity.
Tier 1 signals warrant immediate action. These are high-confidence indicators that an account is actively evaluating and approaching decision. Pricing page visits combined with stakeholder expansion. Demo requests from ICP-fit accounts. Return visits after proposal delivery. Product trial activation of key features. When tier 1 signals fire, sales should act within hours, not days.
Tier 2 signals inform prioritization without demanding immediate response. These indicate elevated interest that merits attention but not urgency. Third-party intent spikes. Engagement with comparison content. Multiple stakeholders from the same account consuming solution-focused material. Tier 2 signals move accounts up the priority queue for outreach sequencing.
Tier 3 signals provide context without triggering action. These track general engagement and account health. Blog visits. Newsletter opens. Social media interactions. Tier 3 signals contribute to account profiles and long-term nurture decisions. They do not warrant dedicated sales attention or real-time response.
Tier assignment should derive from your historical conversion data, not from vendor recommendations or industry benchmarks. The signals that predict conversion for your ICP, in your sales cycle, with your product may differ substantially from generic best practices.
The Validation Loop
Signal hierarchies require continuous validation. Buyer behavior evolves. Competitive dynamics shift. Content that once attracted serious evaluators may now attract casual researchers. A signal that predicted conversion eighteen months ago may have degraded without anyone noticing.
Quarterly signal audits should compare tier assignments against actual outcomes. Pull closed-won opportunities and examine which signals preceded conversion. Pull closed-lost opportunities and examine which signals appeared without predicting the loss. Pull stalled opportunities and identify whether signal patterns differ from deals that progressed.
This analysis reveals signal drift. A tier 1 signal that no longer differentiates converting accounts from non-converting accounts should be demoted. A tier 3 signal that appears consistently in won deals but rarely in losses should be elevated. The hierarchy adapts based on evidence rather than assumption.
Signal validation also exposes data quality issues. If a signal fires frequently but outcome data cannot confirm its predictive value, the signal may be capturing noise rather than intent. If a theoretically strong signal rarely fires, integration or tracking problems may be suppressing visibility.
From Volume to Value
Signal quality determines GTM efficiency more than signal volume. Teams that track fewer signals with higher predictive value outperform teams that track everything and prioritize nothing. The discipline lies not in capturing more data but in distinguishing the data that matters.
Building this capability requires infrastructure that unifies signal sources, applies consistent evaluation frameworks, and enables continuous validation against outcomes. Tapistro connects first-party, third-party, and product signals into a single intelligence layer, then applies AI to surface tier 1 behavior and filter out noise before it reaches your sales team. The result is a GTM motion that responds to genuine buying behavior rather than reacting to activity noise.
The signals are abundant. The insight remains scarce. Closing that gap starts with asking a different question. Not which signals can we capture, but which signals actually convert.

.png)


%20(2).avif)